Why physics makes sense when you watch it move
Students learn motion better when the graph is drawn as the motion happens and forces are shown to scale. What the research says, and how to make one.
By the Chasca team 5 min read
Physics is about things that change: a ball that rises and falls, a mass that swings, current that splits at a junction. A still diagram can only freeze one moment, and a formula only names the change. Students understand motion better when they see it happen, see its graph being drawn by it, and see the forces at their true sizes. The research supports this, with the same conditions that hold for any good animation: show the physics itself, link the words to the picture, and leave time to look.
Why is motion hard to learn from a textbook?
Because the hardest ideas are about how things change over time, and a page can’t change. In a classic study of physics students, Lillian McDermott, Mark Rosenquist and Emily van Zee found that many couldn’t connect a motion with its graph. They read the graph as a picture of the path, confused the height of a curve with its slope, and couldn’t say what the area under a velocity graph meant.
Ideas about force are even more stubborn. David Hestenes, Malcolm Wells and Gregg Swackhamer built the Force Concept Inventory from the everyday beliefs students bring with them, such as that a moving object must have a force pushing it along. Many students still held those beliefs after a physics course. Richard Hake’s survey of about 6,000 students found that courses which made students engage with the ideas roughly doubled their gains on that test, compared with traditional lectures (an average normalised gain of 0.48 against 0.23).
Does seeing physics move help?
On average, yes. Tim Höffler and Detlev Leutner’s meta-analysis of 26 studies found that instructional animations beat static pictures (d = 0.37), more so when the animation showed the content itself rather than decorating it. In science teaching, Nico Rutten, Wouter van Joolingen and Jan van der Veen reviewed a decade of experimental studies of computer simulations and found robust evidence that they can enhance traditional instruction, especially lab work. They also found that a better-looking visualisation doesn’t by itself mean better learning: what it shows, and how teachers guide it, matters.
Simulations such as PhET’s work because they show what a diagram can’t: the field around a charge, the current in every branch of a circuit, the path a projectile really takes. A video can borrow the same idea. It can’t be explored like a simulation, but it can guide the viewer through the moments that matter, at the pace of an explanation.
Why draw the graph while the object moves?
Because the graph then means something. In the early days of classroom computers, Ronald Thornton and David Sokoloff let students see graphs of their own motion drawn in real time by a motion sensor. Their understanding of velocity and acceleration graphs improved far more than with traditional teaching. The link between the motion and the line was made by watching one draw the other.
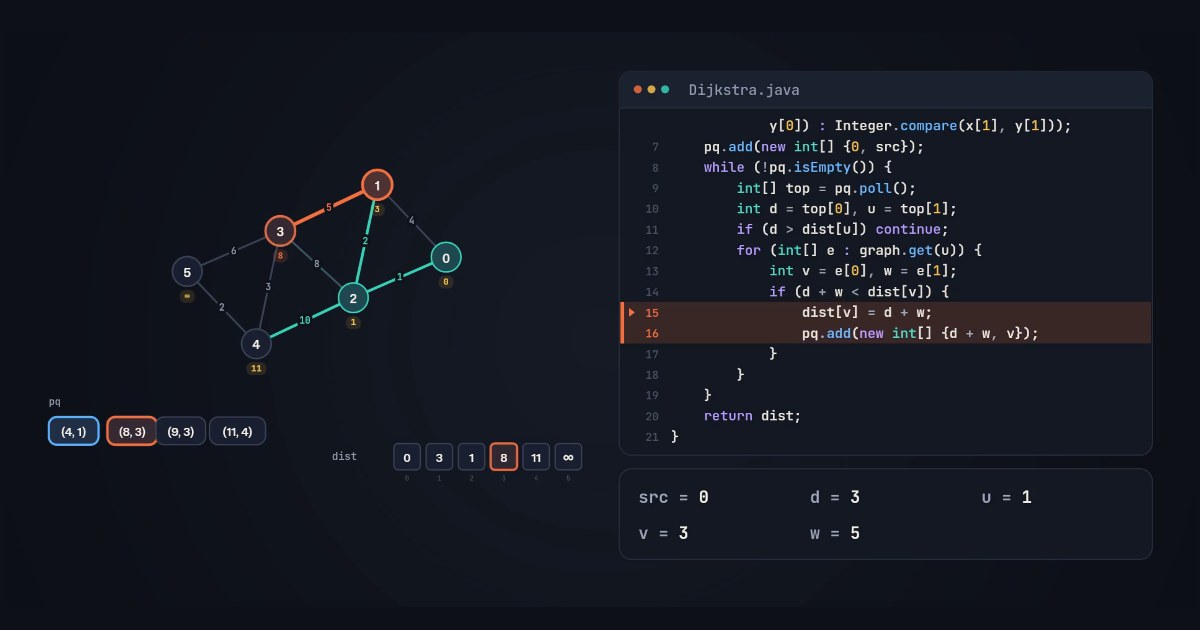
An explainer video can do the same: a mass bounces on a spring while its position traces a cosine beside it; a ball flies while its horizontal velocity stays flat and its vertical velocity falls in a straight line. In a study of 14 widely watched physics explainers, we found graphs in many but drawn alongside the motion in only two. That is the gap a good physics explainer should fill.
Why draw forces to scale, in colour?
Because the arrows are the argument. On a 2 kg block on a 30° ramp with friction, the weight of 19.6 N splits into 9.8 N down the slope and about 17 N into it; the normal force balances the second part, and friction of about 3.4 N can’t stop the first. If the arrows are drawn to scale, the viewer sees that before the arithmetic. If they aren’t, the picture says nothing the narrator hasn’t.
Colour does the linking. Shaaron Ainsworth’s framework for learning with several representations explains why learners need help connecting a picture, a graph and an equation. Giving each quantity one colour, in its arrow, its label and its term in the equation, makes the connection without a word.
What does a good physics explainer need?
From the research and from the best explainers on YouTube:
- A situation first. A thrown ball or a swinging lamp, and one question about it.
- Motion before the rule. Let the viewer watch it happen, then name the law.
- Real numbers. A 20 m/s launch at 45°, a 6 V cell, a 2 kg block: values that give clean results.
- The graph drawn by the motion, not shown after it.
- Forces to scale, one colour each, with the same colour in the equation.
- One idea at a time: x then y, along the slope then across it, current then voltage.
- A pause at the click, when the rays cross, the forces balance or the grid of nuclei halves.
- Correct physics. A path that is a real parabola, rays that meet where the lens formula says.
How do you make one with Chasca?
With the Visual physics skill:
- Ask about an idea. Type a topic or a question (“Why does a ball thrown at 45° go the farthest?”), paste your notes, or choose My words, word for word and paste your script.
- Pick the language and a voice. Any of Chasca’s 79 languages; Arabic runs right to left. Your own voice works too.
- Watch it worked out. Every motion is computed from its numbers: the path, the swing, the orbit, where the rays meet, every current in the circuit. Graphs and energy bars trace themselves beside the motion, and each equation writes itself in, coloured like the arrows and bodies it names.
- Check the page. The script is checked against what the simulation works out; if something needs a look, the video’s page says where.
Visual physics makes videos from one to 10 minutes on paid plans, and a minute on the free ones. For a sheet of exam questions solved step by step, use Science problems. For maths ideas, Visual maths. To compare the tools people use for physics videos, see the best physics explainer video tools.
Sources
- McDermott, Rosenquist and van Zee (1987), Student difficulties in connecting graphs and physics, American Journal of Physics.
- Hestenes, Wells and Swackhamer (1992), Force Concept Inventory, The Physics Teacher.
- Hake (1998), Interactive-engagement versus traditional methods, American Journal of Physics.
- Thornton and Sokoloff (1990), Learning motion concepts using real-time microcomputer-based laboratory tools, American Journal of Physics.
- Höffler and Leutner (2007), Instructional animation versus static pictures: a meta-analysis, Learning and Instruction.
- Rutten, van Joolingen and van der Veen (2012), The learning effects of computer simulations in science education, Computers & Education.
- Wieman, Adams and Perkins (2008), PhET: simulations that enhance learning, Science.
- Ainsworth (2006), DeFT: a conceptual framework for considering learning with multiple representations, Learning and Instruction.
Video transcript What the narrator says in the 1:13 explainer above.
Why does a mass keep bouncing on a spring, and where does its energy go?
Pull this one-kilogram mass one metre from equilibrium, then release it. There’s no friction, so watch it keep oscillating.
Now trace its position against time: a smooth cosine curve. Each complete oscillation takes about three point one four seconds.
The restoring force points towards equilibrium, proportional to displacement. So acceleration is opposite and proportional to displacement: simple harmonic motion.
At equilibrium, will the energy be stored in the spring, or moving with the mass?
Watch the spring relax: stored energy becomes kinetic energy. At equilibrium, all two joules are kinetic.
The mass keeps moving, compressing the spring until it stops. Now all two joules are stored again.
So the bouncing is an energy exchange, not energy creation. Without friction, the same two joules keep changing form.
Questions people ask
On average, yes, when they show the physics itself. A meta-analysis of 26 studies found instructional animations beat static pictures (d = 0.37), and a review of a decade of experimental studies of computer simulations in science found they can enhance traditional teaching, especially in lab work.
Because students often read a graph as a picture of the path and confuse its height with its slope. Real-time graphing, where students see the graph being made by a motion, was found in early studies to improve their understanding of motion graphs markedly.
Because the arrows are the argument. When a longer arrow means a bigger force, the viewer can see whether forces balance, which one wins and why the object speeds up, before any arithmetic. Common misconceptions about force survive ordinary lectures, as the Force Concept Inventory showed.
Chasca's Visual physics skill makes one from a topic, a question, your notes or your own script: the motion is worked out from real numbers, graphs and energy bars trace themselves beside it, and each equation writes itself in, coloured like the arrows and bodies it names.
Yes. The Visual physics skill narrates in any of Chasca's 79 languages, with the words on screen in that language and Arabic written right to left.