Science and social science teachers
Show the experiment you can’t run in class: an epidemic with and without people staying home, natural selection over generations, a market finding its price, waves meeting in a ripple tank.
Skills Simulation lab
Ask a question, paste your script, or add a paper, a lab report or a table of measurements, and Chasca makes a narrated video that runs the model on screen: an outbreak spreading through a school, hares and lynx rising and falling, a pendulum, a gas, heat crossing a plate, cars bunching into a jam. The equations or rules come from your words or your material, and every number in the narration and on the chart is read from the run itself, so what viewers see is what the model does.
At a glance
Who it’s for
Show the experiment you can’t run in class: an epidemic with and without people staying home, natural selection over generations, a market finding its price, waves meeting in a ripple tank.
Turn a paper, a thesis chapter, a lab report or a dataset into a short video for a talk, a class or a post, with your model run as written and your measurements on the chart.
Publish videos where the idea plays out on screen, in any language, without coding a simulation or animating it by hand.
How it works

Ask why outbreaks explode, paste your own script, or add a paper, a lab report or a table of measurements as a PDF, a document, a CSV or an Excel file. Any language.
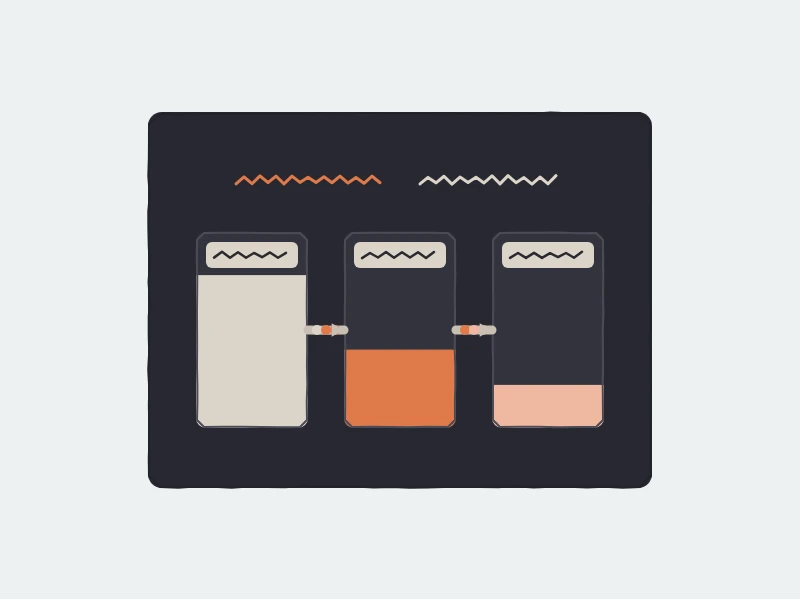
Its equations or rules, its settings and its starting values are taken from your words or your material and run exactly, before anything is said.
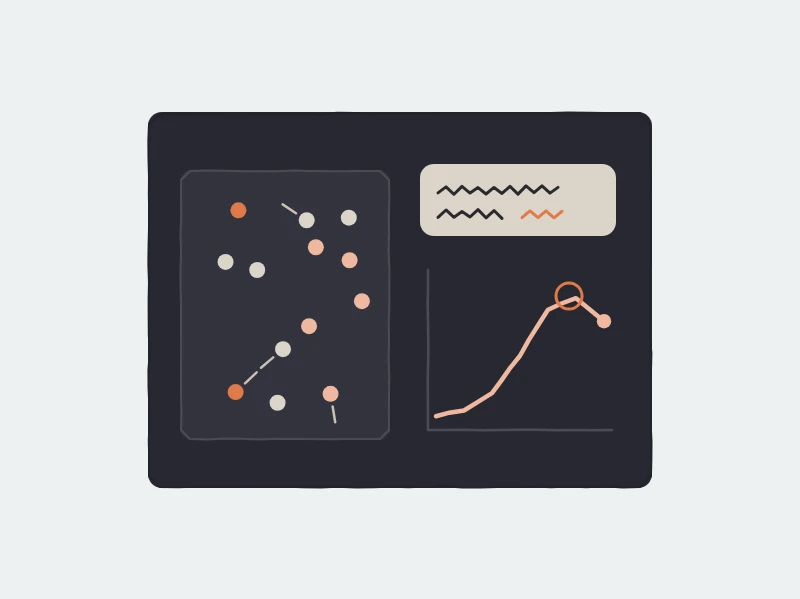
Your script is narrated word for word, or the story follows your material in its own order. The world gets there as the words say what happened.
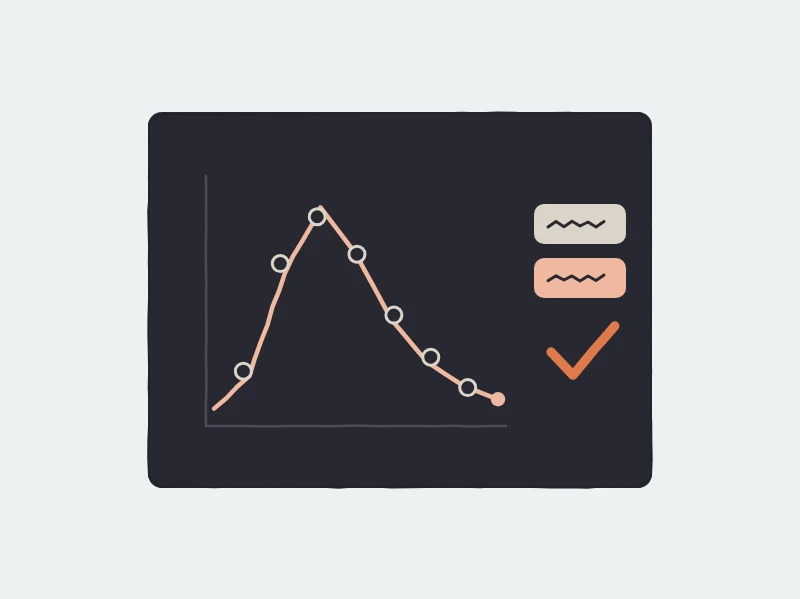
Each result your material reports is compared with the run, and the video’s page lists what matched and what differs.
Examples
A made-up study of flu in a boarding school, run as an SIR model: pupils move from susceptible to ill to recovered as tanks fill and drain, and fewer contacts give a lower, later peak.
PromptExplain this study for my biology class: how the flu spread through the school, and what closing it for a long weekend would have changed.
Made from a PDFSimulation labEnglish
A ring road where every driver follows three simple rules: a tap on the brakes grows into a jam that drifts backwards, then steady drivers flow at full speed. A script narrated word for word, on the dark look.
TryHave you ever been stuck in traffic with no crash, no roadworks and no lights ahead? Let's watch a ring road where every driver follows three simple rules. Speed up when there is space. Slow down to keep a safe gap. And sometimes, for no reason at all, brake a little. At first the cars flow smoothly around the ring. Then one driver taps the brakes. The driver behind brakes a bit harder, and the one behind that harder still. A knot of stopped cars appears, and it drifts backwards around the ring, even though every car keeps moving forward. Now take away the random braking. With every driver steady, the same cars flow at full speed, lap after lap. A traffic jam doesn't need a cause. It only needs us to be a little bit human.
Made from a written scriptSimulation labEnglish
Hares and lynx rising and falling in turn, from a made-up predator and prey study run as its equations, explained in Hindi.
Promptइस अध्ययन को आसान हिंदी में समझाइए: खरगोश और लिंक्स की आबादी हर कुछ साल में ऊपर-नीचे क्यों होती है?
Made from a promptSimulation labHindi
A made-up chemistry lab report run from its rate equation: dinitrogen pentoxide decomposing, its half-life read from the run, and the report’s measurements on the chart.
PromptTurn my lab report into a short video for my chemistry class.
Made from a promptSimulation labEnglish
Why a cup of tea cools quickly at first and then slows, shown with Newton’s law of cooling, in Arabic, right to left.
Promptلماذا يبرد كوب الشاي بسرعة في البداية ثم يبطئ؟ اشرحها بقانون نيوتن للتبريد.
Made from a promptSimulation labArabic
Yeast cells counted every two hours in two flasks, replayed point by point from a made-up table of counts, the two flasks compared on one chart.
PromptMy class counted yeast cells in two flasks every two hours. Show what the counts tell us.
Made from a CSV file of dataSimulation labEnglish
Why we built it
Researchers and teachers who want to show a model working have had two choices: code the simulation and animate it, which takes days, or use a video that only looks like one. So most explanations of an epidemic curve, a predator–prey cycle or a half-life end up as a still chart. We built Simulation lab so that any model someone can write down, in any language, can be watched while it runs.
Yes. Add the paper (a PDF or a document) to Chasca’s Simulation lab skill, and the model it describes is read and run: its equations or rules, its parameters and its starting values. The video explains what was studied in the paper’s own order and terms while the model runs on screen, with a chart that grows from the same run. When the paper reports results, each one is compared with the run, and the video’s page lists what matched and what differs.
Epidemics (SIR-style outbreaks, with and without people staying home), predator and prey, natural selection, a market finding its price, Schelling’s segregation model, traffic jams on a ring road and a Galton board; a thrown ball with and without air resistance, pendulums at any angle, springs and resonance, orbits (three bodies too), collisions, a gas and its speed distribution, diffusion, heat spreading through a plate, ripples and two-source interference, a forest fire, a magnet cooling through its transition and Turing patterns. Beyond these, the equations a paper or a lab report states (differential or difference equations, such as decay, logistic growth, SIR or Lotka–Volterra) are run as written, and a table of measurements is replayed point by point.
The model is run exactly as it is set up, before the narration is written, and every number the voice says or the chart shows is read from that run. Physics worlds follow their equations and match textbook results, such as a pendulum’s period at any angle or the ellipse of an orbit. A model it can’t run is refused with the reason, never swapped for a different one. A world shows how a model behaves; it isn’t a forecast of a real outbreak or market.
Yes. Add a table of measurements as a CSV or Excel file, or paste it into the request. The measurements are replayed point by point on an animated chart, beside a picture that follows the values: tanks, a thermometer, a growing crowd of cells or a ball on a ruled track. Every number said comes from your measurements. A photo or scan of a table isn’t read, so add it as a file or as text.
Yes. Pick “My words, word for word” and paste your script: every word is narrated as written, and the skill sets up the world, its runs and its chart around your sentences, so the world gets there as you say what happened. If the run doesn’t bear out something your script states, the video’s page tells you; your words are never changed.
Coding gives you full control, but it takes days: writing the model, solving it, animating it, recording a voice and timing them together. Simulation lab does all of that from a question, a script or your material in minutes, narrated in any of Chasca’s 79 languages. Use code or an interactive simulation when students should change the settings themselves; use Simulation lab when you want a finished, narrated explanation.
Visual physics explains a physics idea with diagrams worked out from its numbers: forces to scale, rays, circuits, fields. Simulation lab runs a whole world over time, from your question or your research, with its chart beside it: outbreaks, markets, populations and experiments as well as physics. Use Visual physics for a topic in a physics course and Simulation lab to show a model or an experiment running.
All 79 languages Chasca narrates in. The words and numbers on the worlds and the chart are in that language too, and in Arabic they read right to left.
From one minute to 10 minutes on a paid plan, 90 seconds by default; the free videos are up to a minute.
Your first 2 videos are free, up to 1 minute each, watermarked. No card required. A skill works on the free videos too, up to a minute. After that, plans start at $9.99 a month for 30 minutes. See pricing.
More skills
Physics shown moving: forces to scale, rays that meet, graphs traced as things move.
Your data as a narrated chart video: bar races, lines that draw, before and after, every number from your file.
Biology processes shown moving: dividing cells, DNA to protein, the heart, food webs, labelled as they are named.
Your first 2 videos are free, up to 1 minute each, watermarked. No card required. Full product, every voice and style included.