Economics teachers
Give the problem set its graphs, drawn as you draw them in class, so a student revising alone sees why the new equilibrium sits where it does.
Skills Economics problems
Type the problem with the curves’ equations or numbers, or drop a photo or PDF of the sheet, and Chasca makes a video that solves it the way an economics teacher does at the board: the axes, each curve drawn from its equation as it is named, the equilibrium where they cross, then the shift, the new equilibrium and what happened to price and quantity. It is made for economics teachers and tutors, works elasticity, costs and tax too, and solves every answer a second time before the video is made.
At a glance
Who it’s for
Give the problem set its graphs, drawn as you draw them in class, so a student revising alone sees why the new equilibrium sits where it does.
Turn past-paper questions on equilibrium, elasticity and costs into worked solutions whose graph matches the numbers in the working.
Explain a price in the news, like coffee after a frost cuts the harvest, with a graph viewers can follow one curve at a time.
How it works
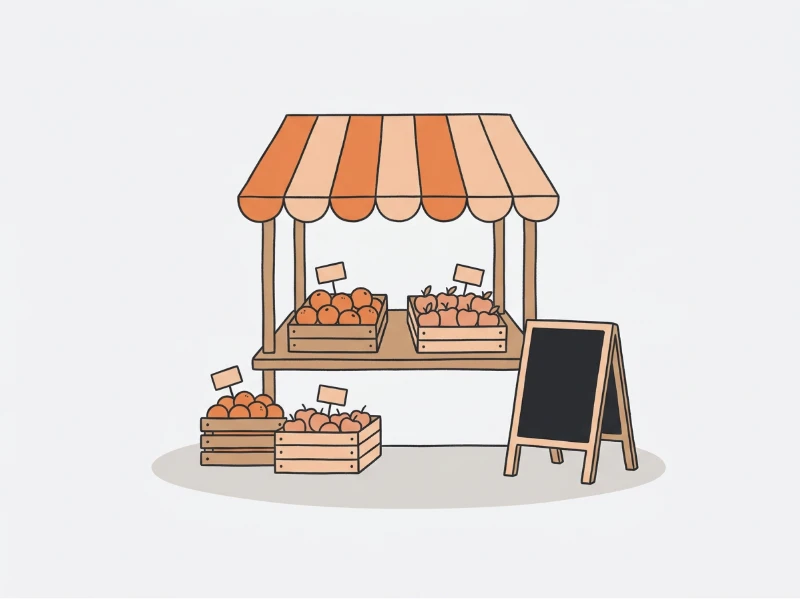
Supply and demand, elasticity, costs, surplus and tax, with the curves’ equations or numbers, or a photo of the sheet.
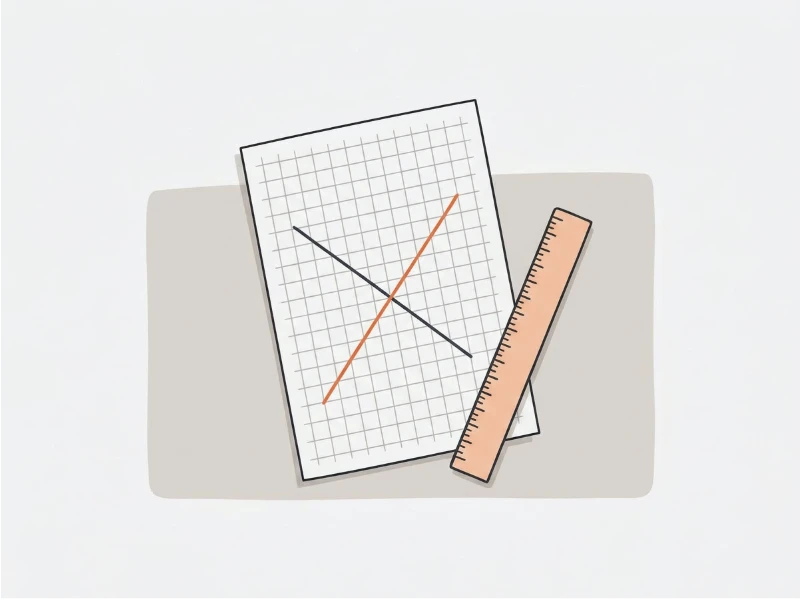
Every curve is drawn from its real equation, so the graph is exact, never a sketch.
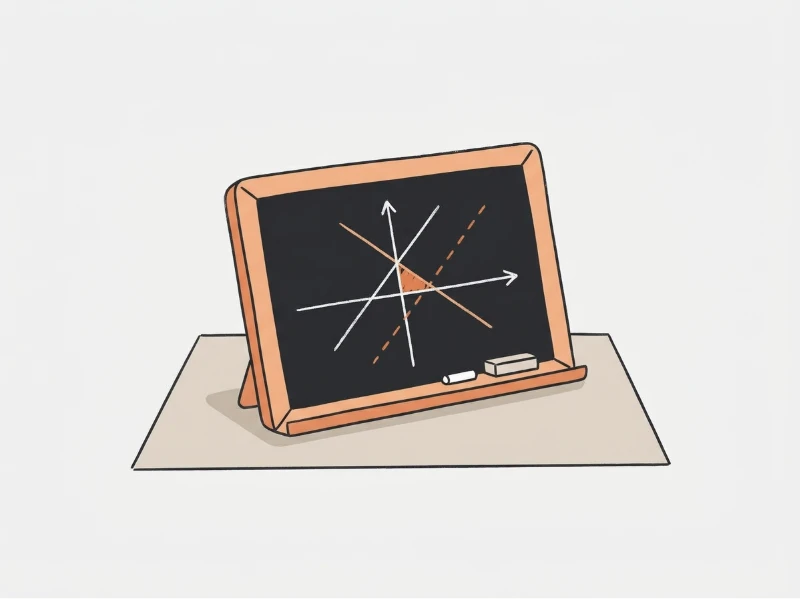
The equilibrium is found with guide lines, and the shifted curve is drawn dashed beside the old one.
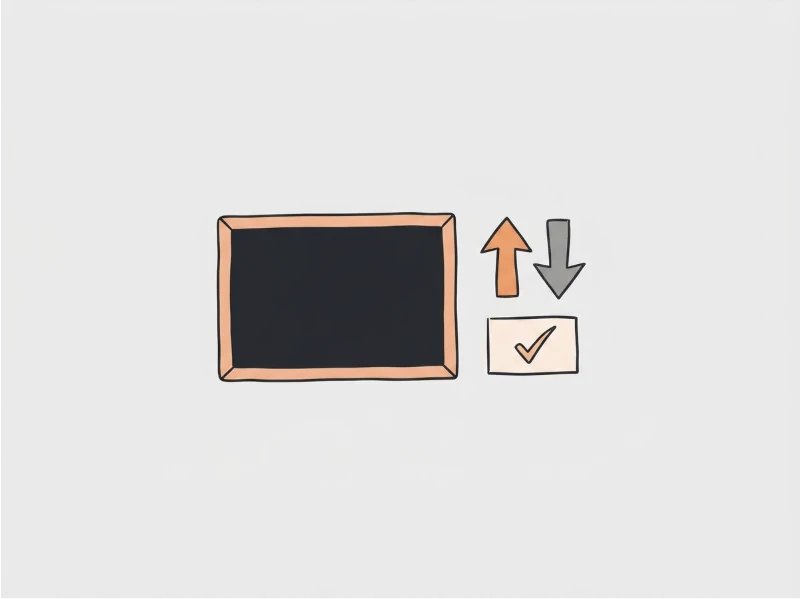
Price and quantity before and after, explained in plain words, with the answer boxed.
Examples
Both curves drawn from their equations, the equilibrium found with guide lines, then the new demand curve and what changed.
PromptQd = 20 − 2P and Qs = 3P. Find the equilibrium price and quantity. Then demand rises to Qd = 30 − 2P: find the new equilibrium and explain what happened to price and quantity.
Made from a promptEconomics problemsEnglish
Both percentage changes worked out, then what the result means, said plainly: unit elastic.
PromptThe price of a good rises from ₹10 to ₹12 and the quantity demanded falls from 100 to 80 units. Find the price elasticity of demand and say whether demand is elastic or inelastic.
Made from a promptEconomics problemsEnglish
A supply shift in Spanish on an exact graph: the old and new equilibrium, the shifted curve drawn dashed.
PromptExplica con un gráfico qué pasa con el precio del café si una helada reduce la oferta.
Made from a promptEconomics problemsSpanish
A per-unit tax on an exact supply and demand graph: the new equilibrium found, then the burden split between buyers and sellers.
PromptDemand is Qd = 100 − 10P and supply Qs = 10P. A tax of ₹2 a unit is put on sellers: what do buyers pay and sellers keep?
Made from a promptEconomics problemsEnglish
A ceiling drawn below equilibrium on an exact graph, the quantities demanded and supplied read off, and the gap named as the shortage.
PromptDemand is Qd = 100 − 2P and supply Qs = 2P − 20. A price ceiling of ₹25 is set: find the shortage.
Made from a promptEconomics problemsEnglish
Total cost differentiated term by term, marginal cost found at ten units, and why the fixed cost drops out.
PromptTotal cost is TC = 100 + 5Q + Q². Find the marginal cost at Q = 10.
Made from a promptEconomics problemsEnglish
A market in French on an exact graph: the equilibrium worked out, then supply raised by 30 units at every price and the new equilibrium found.
PromptLa demande est Qd = 120 − 3P et l’offre Qs = 3P. Trouvez l’équilibre, puis le nouvel équilibre si l’offre augmente de 30 unités à chaque prix.
Made from a promptEconomics problemsFrench
Why we built it
Economics students are asked to show what happens on a graph, and a graph whose lines cross in the wrong place teaches the wrong answer. Teachers draw these graphs by hand at the board, one problem at a time. We built the economics skill so every problem in a set can have its graph drawn exactly, part by part as the reasoning reaches it.
Read why we built itYes. Chasca’s Economics problems skill makes a narrated video that solves the problem on a teacher’s board with an exact graph beside the working: each curve drawn from its equation as it is named, the equilibrium with guide lines, then the shift and what happened to price and quantity.
Yes. Each curve is plotted from its equation, so where the curves cross on the graph is the real equilibrium, and the answer is solved a second time on its own before the video is made. A shifted curve is drawn dashed beside the old one.
No. With equations or numbers, your curves are drawn exactly. For a question in words, such as what a frost does to the price of coffee, straight-line curves are drawn whose crossings match what is said.
Yes. Price elasticity, costs, the multiplier and national income are worked from the formula: the values, the substitution, then the answer with its sign and what it means.
Yes. Ask for problems on a topic at a level, such as AP, IB, A level or Class 12, and it writes exam-style ones with straight-line curves and numbers that work out cleanly, then solves them.
From one minute to 30 minutes on a paid plan; the free videos are up to a minute. A video follows its problems, each on its own board with its own graph.
Your first 2 videos are free, up to 1 minute each, watermarked. No card required. A skill works on the free videos too, up to a minute. After that, plans start at $9.99 a month for 30 minutes. See pricing.
More skills
Journal entries, ledgers and trial balances worked row by row, with debits and credits added up.
Problems solved step by step on a teacher’s board, with a pointer and the answer boxed.
A funny vertical cartoon in which a mascot acts out one money idea with props and big red numbers.
Your first 2 videos are free, up to 1 minute each, watermarked. No card required. Full product, every voice and style included.